
How much of your sales budget is replacing revenue you already had?
At 8% reported churn, the answer is 20% of revenue. Most CFOs see one quarter of that on the P&L, and the rest hides inside the sales budget, the expansion plan, and the next forecast cycle.
Three layers, one number, compounding every quarter you ignore it.
The Churn Tax model I built and use.
What most companies measure
Most companies measure churn as the revenue that did not renew. One layer, one clean number on a slide.
That number represents roughly 40% of what churn costs you. The other 60% sits in two places your finance team is not connecting back to retention: the expansion revenue forfeited on the cohort you lost, and the cost of replacing the lost ARR through sales and marketing motion.
I built the Churn Tax model to make all three layers visible.
The three layers
Layer 1. Lost recurring revenue. The contracts your customers did not renew, the number on your churn dashboard. At $300M ARR and 8% reported churn, $24M.
Layer 2. Forfeited expansion. Existing customers expand at 8% to 12% per year in a healthy SaaS book. When you churn a customer, you lose the expansion they would have produced over the life of the account. Conservative midpoint at $300M ARR: $18M of forfeited multi-year expansion.
Layer 3. Replacement cost. Sales and marketing dollars spent acquiring new ARR to replace the lost ARR. At a 1.3 CAC ratio, replacing $24M of lost revenue burns $18M of sales and marketing capacity, capacity you should be deploying against net-new growth.
Add the three.
Effective Churn Tax: $60M. 20% of $300M revenue. A 2.5x multiplier on the reported churn loss.
The Churn Tax at scale
Conservative model. 8% reported churn. 2.0x multiplier at the midpoint scenario.
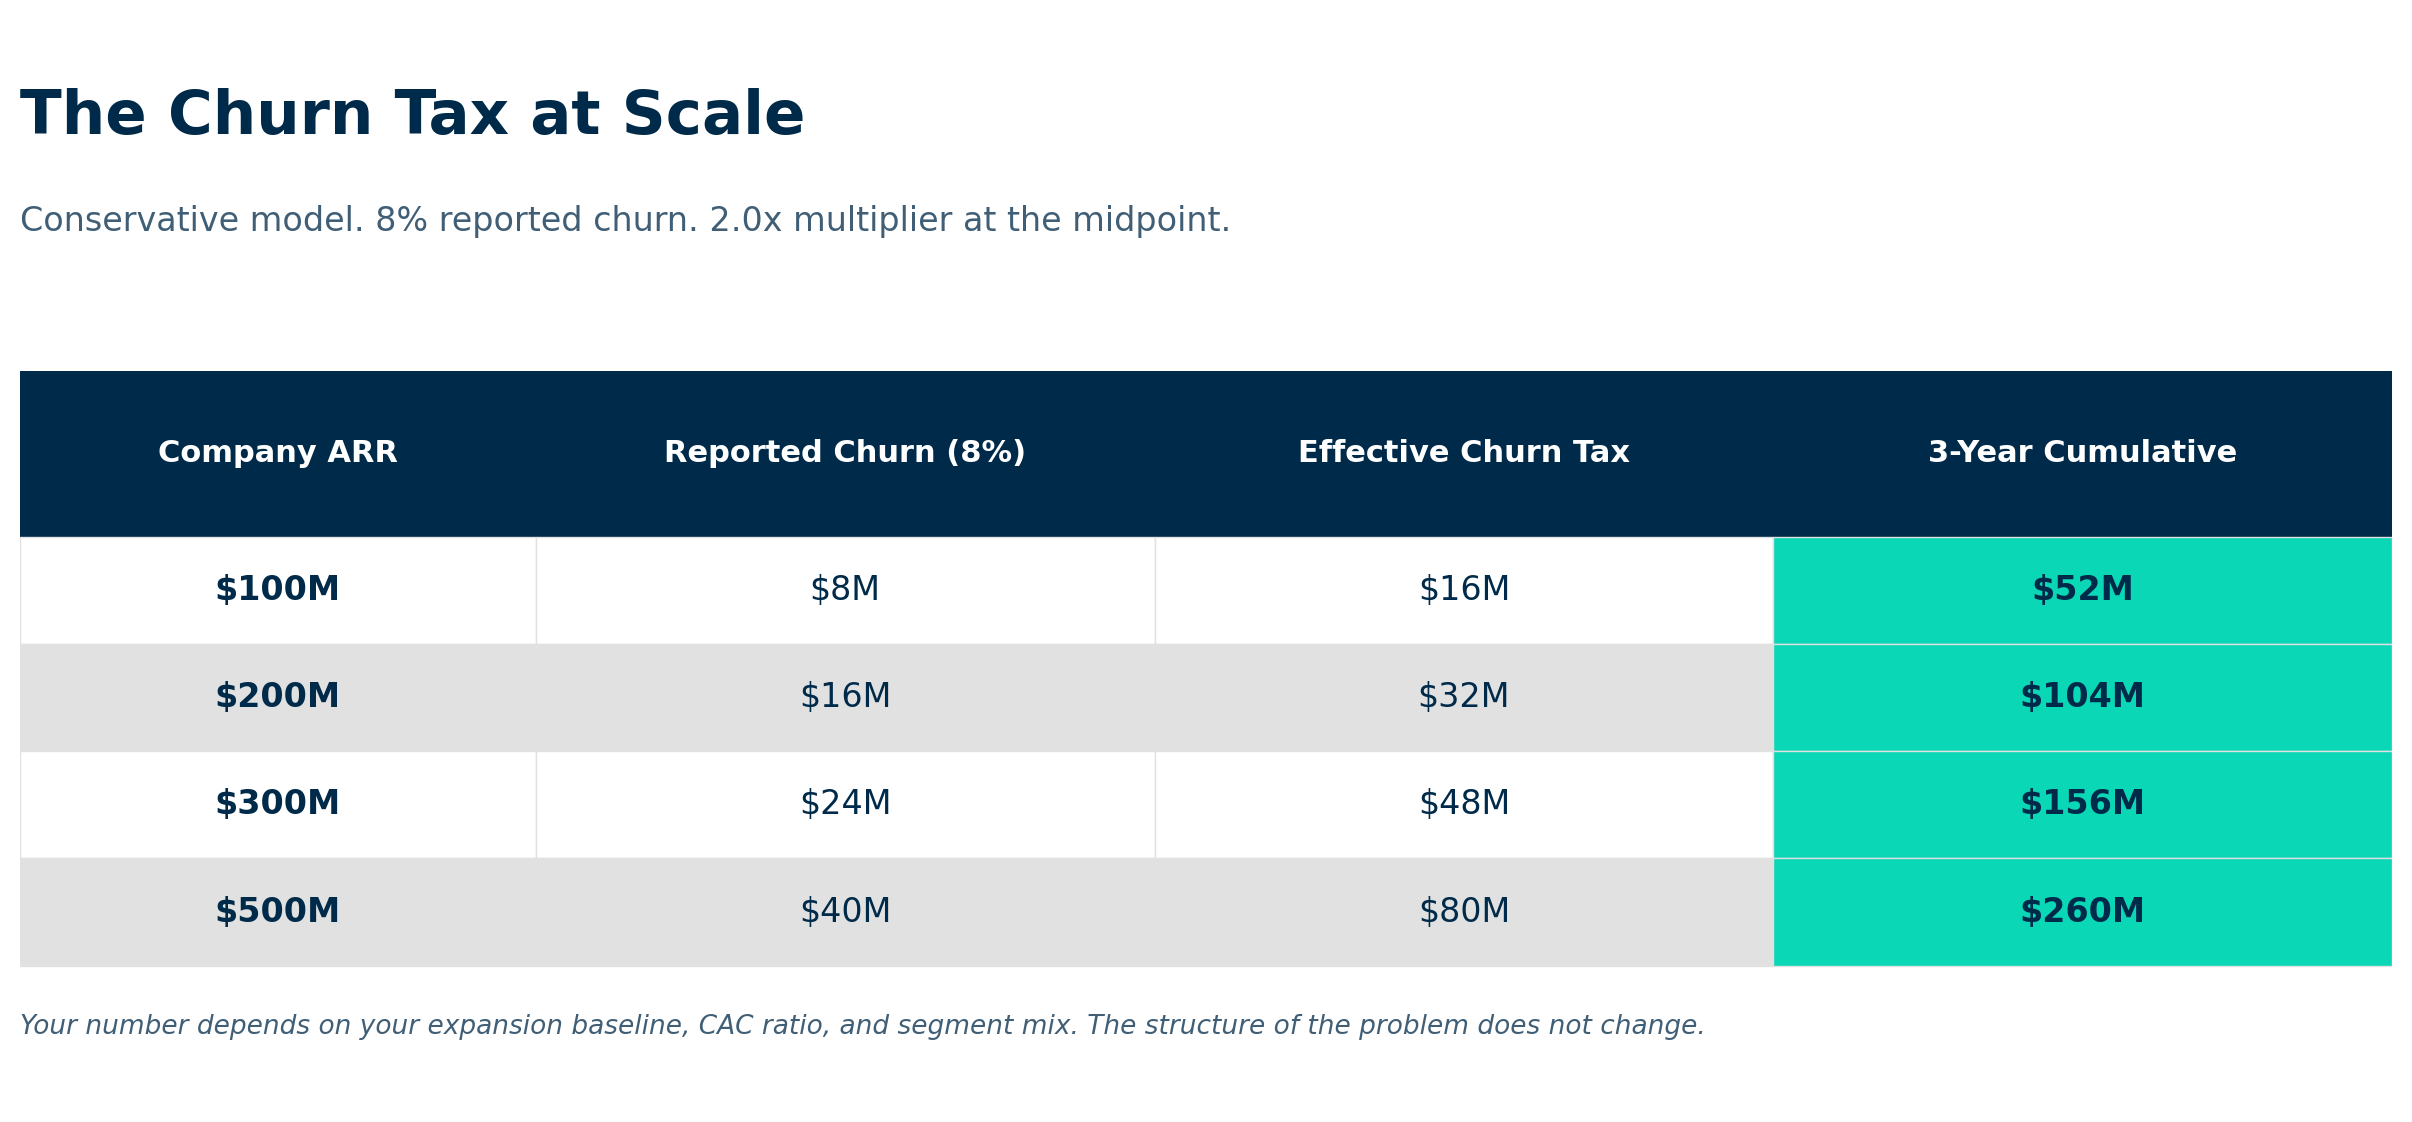
The range. Reported losses move with reported churn. Effective Churn Tax sits between 1.5x and 2.5x the reported number, depending on expansion economics and CAC efficiency. The midpoint is what I use for board cases.
The recovery curve
Customer Success run as a revenue investment takes 3 to 4 quarters to show up in retention metrics. PLG-led books move faster, and enterprise books usually take 4 to 6 quarters. The dashboard does not move next month.
What does move:
Year 1. Investment funds the build, churn reduction begins on the back half of the year, expansion motion stands up. Net result: 1.0x return.
Year 2. Churn drops 2 percentage points, expansion contribution from Customer Success crosses 25% of new ARR. Net result: 1.8x to 2.0x return.
Year 3. Churn drops 3 percentage points off the original baseline, expansion contribution at 30%+ of new ARR, NRR crosses 105%. Net result: 3.0x to 3.5x return.
Based on a $300M ARR model. Scale proportionally.
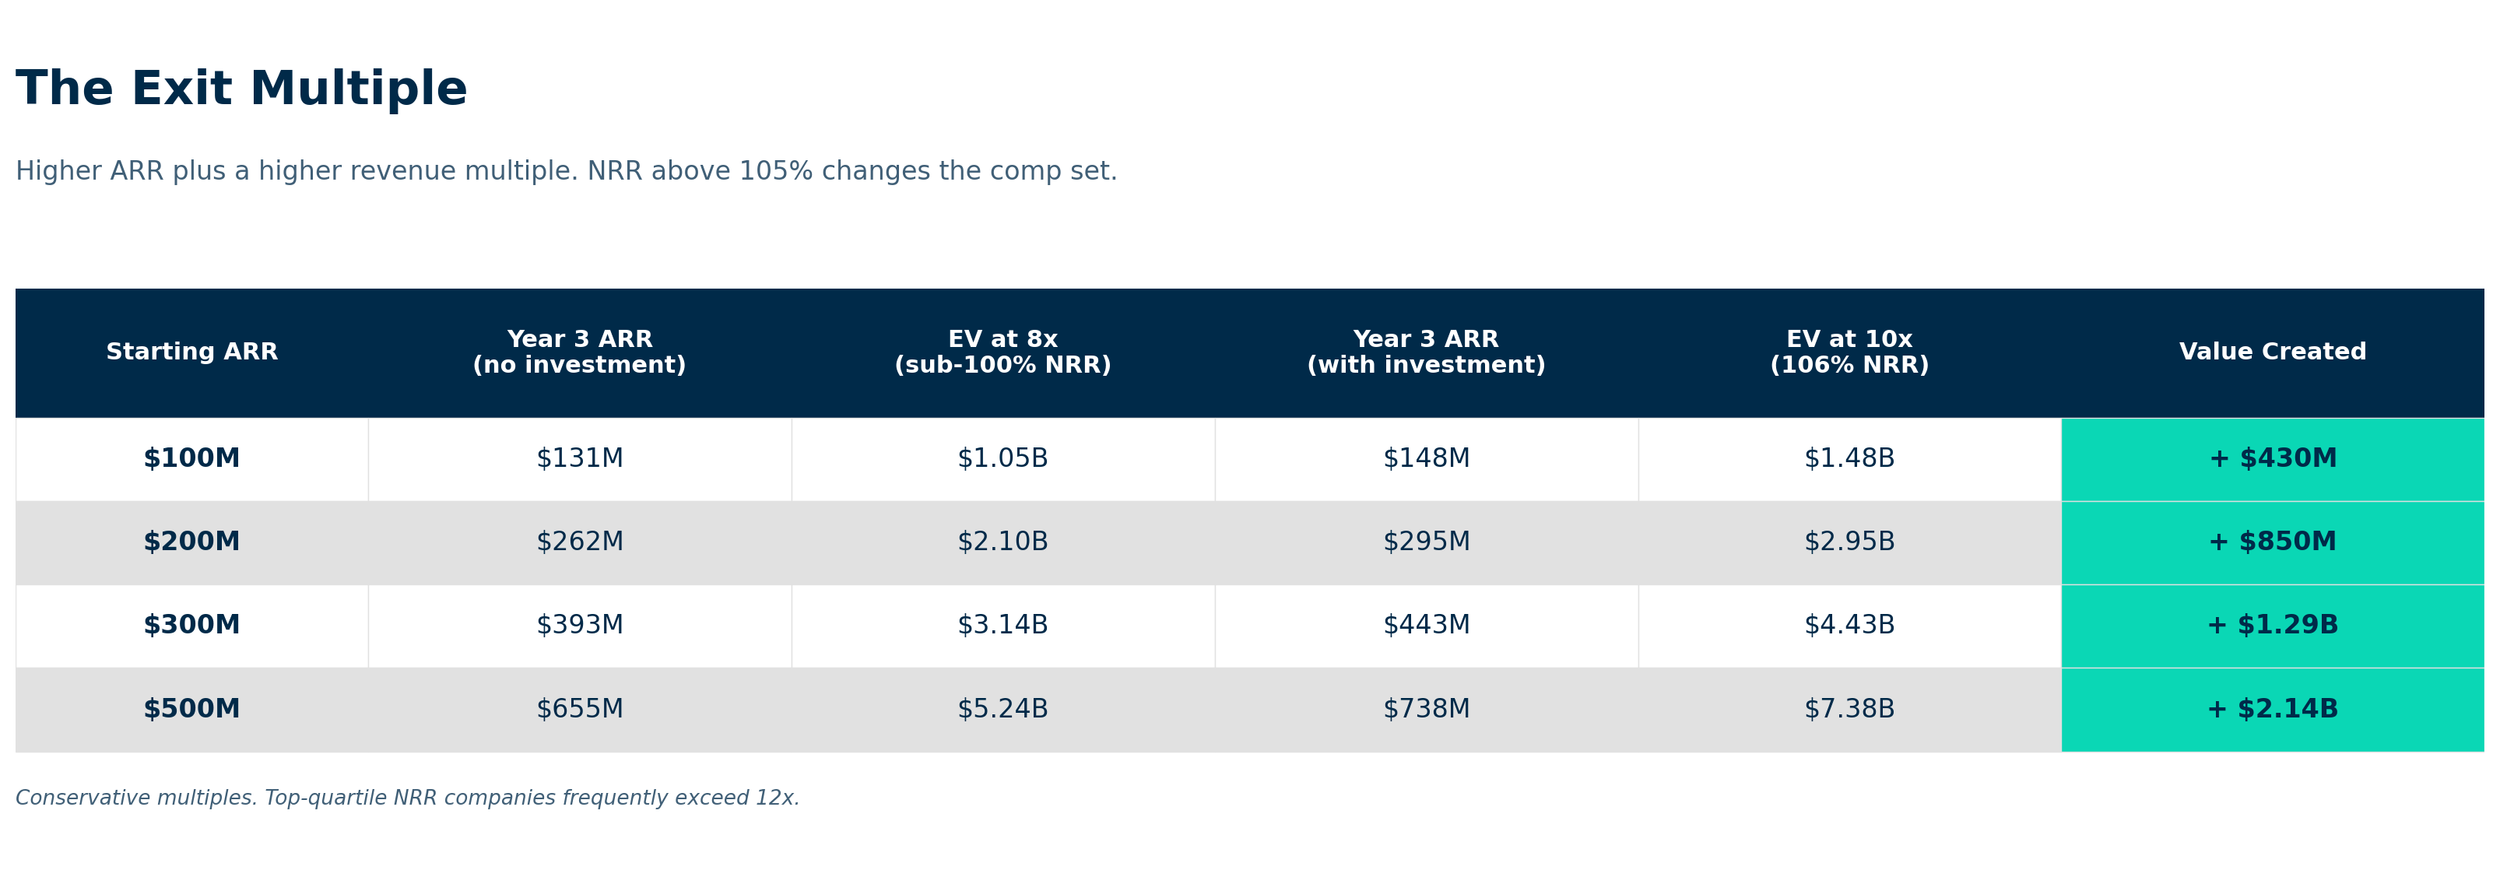
The exit multiple
The investment creates value two ways: higher ARR, and a higher revenue multiple at exit.
Public SaaS comps and PE transaction benchmarks show companies with NRR above 105% trade at 2x to 3x the multiple of companies below 100%. The math:
My view
I have run this math at $350M to $1B ARR companies, PE-owned and NYSE-listed. The pattern is always the same.
The board funds the Customer Success investment when it sees the Churn Tax in three layers. The CFO funds it when the model shows 12-month payback and a 3x return inside the exit window. The CEO funds it when the recovery curve aligns to the next exit cycle.
Anyone running this math with a single-layer model is missing 60% of the case.
Want your Churn Tax calculated on your numbers?
The Diagnostic is a 4 to 6 week engagement run through Success Calibrators. You walk away with your effective Churn Tax, the three-layer breakdown, a Customer Success maturity assessment scored across 7 dimensions, and recovery priorities and projections, sized for your board.